

Future-proof your ever-evolving IT network with NetFlow Analyzer and keep bandwidth issues at bay, anyday.
Download now
NetFlow Analyzer, a complete traffic analytics tool, that leverages flow technologies to provide real time visibility into the network bandwidth performance. NetFlow Analyzer, primarily a bandwidth monitoring tool, has been optimizing thousands of networks across the World by giving holistic view about their network bandwidth and traffic patterns. NetFlow Analyzer is a unified network traffic monitor that collects, analyzes and reports about what your network bandwidth is being used for and by whom. NetFlow Analyzer is the trusted partner optimizing the bandwidth usage of over a million interfaces worldwide apart from performing network forensics, network traffic analysis and network flow monitoring.
 View performance, bandwidth consumption, recent device configuration changes on a single snapshot page. Be sure of what’s causing trouble with our traffic monitoring software and fix it before it impacts end users.
 View applications that contribute most to utilization from the Inventory. Drill down to the Application snapshot page and view the top sites. Create and schedule threshold-based alarms and get notified on the go via SMS, email, SNMP trap or even SDP tickets.
 Create and schedule threshold-based alarms and get notified on the go via SMS, email, SNMP trap or even SDP tickets.
 Monitor multiple remote sites from a central location with probe specific controls to visualize performance hiccups. View details of devices running on the probe server from a central server's web client.
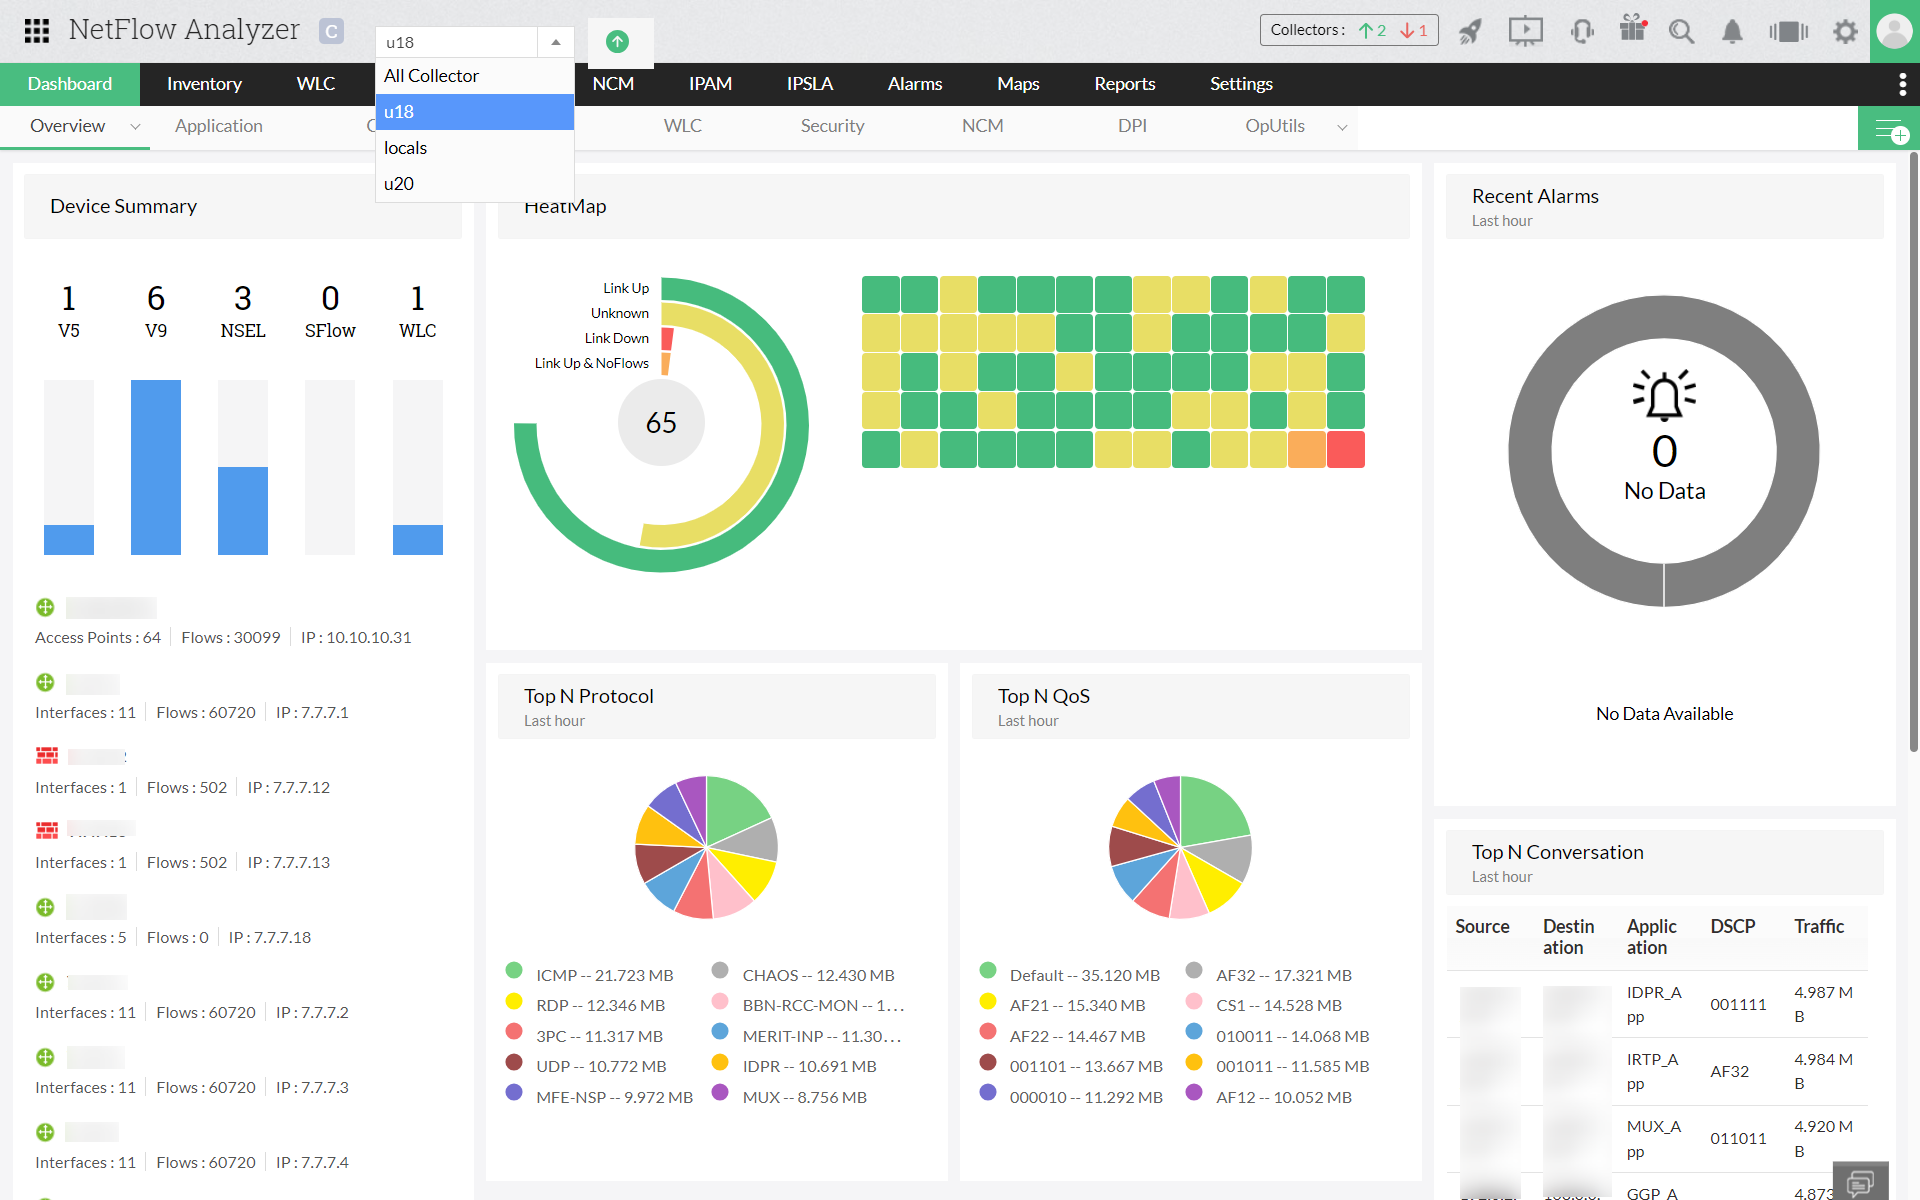 Monitor health, availability and performance across all probes through the central server dashboard. The central server is designed to provide required network visibility across locations, easily scale, consolidate, and report network health over multiple remote probes.
 View details of devices running on the probe server from the central server's web client and drill down to view device, interface and application details.
 Analyze data on various attacks based on type and severity. Drill down further to view each event in detail with the top source, destination and offenders count.
  Create service policies, and compare pre-policy and post policy performances with detailed CBQoS reports.


NetFlow analyzer, it speaks for itself. It gives us a good insight into what's happening on the network. The security team and network team use it quite extensively. It's a great product, easy to use.
ICT & ServiceDesk Plus Administrator,
Australian Community Media
